Explore the OASIS CLI & TUI
Click through planning, run monitoring, results, and evidence
Interactive TUI tour
Get oriented before you begin
OASIS opens with a clear view of what is ready and what you can do next.
Recorded · sanitized · offline
Plan before spending
Before a run starts, OASIS shows which files and rubric items it found, how each media type will be handled, which model service will be used, how many calls to expect, and what they may cost.
Follow the evidence
Every result stays linked to its run, plan, source files, model details, and review status.
Keep people in control
OASIS asks for confirmation before consequential steps, shows incomplete runs clearly, and keeps cancellation and human review within reach.
What this tour represents
These recordings use predictable test data or synthetic examples, with credentials removed. They show how the interface works; they are not evidence of a live grading run. Motion starts only when requested, stops when the viewer closes it, and stays off for visitors who prefer reduced motion.
The CLI and TUI are part of the OASIS software release process; this project page currently publishes demonstrations and the technical report only. Release materials will identify their exact contents and version when available.
For a longer example, follow three coded Candle Making notes from local file checks through a cache-backed MCP run and verified evidence. It uses the real OASIS CLI and MCP server with a local test service that always returns the same prepared responses; the page explains exactly what was—and was not—run.
Read the five flow descriptions
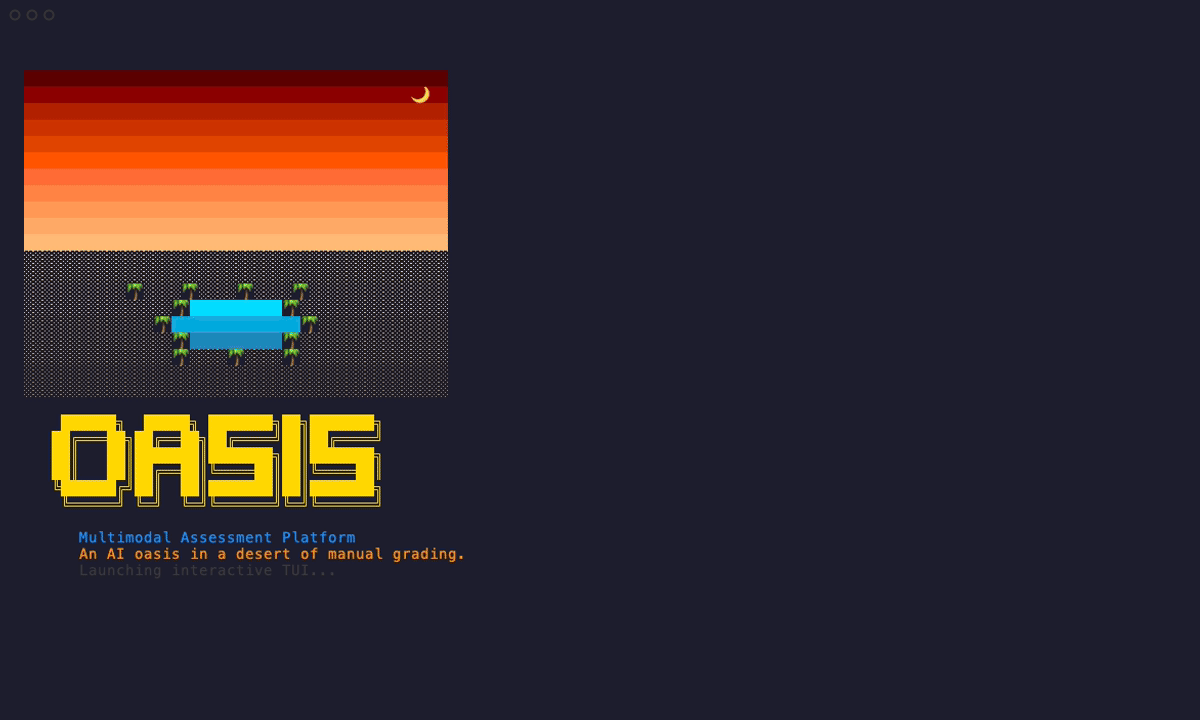
- Splash & INFO: The launch screen opens INFO, where you can see what is ready and which operations are available.
- Dashboard: Four recorded service checks appear healthy while the run list and selected run show progress and the next action.
- Workflow: Sanitized inputs are added to a workflow and previewed as a dry-run plan before execution.
- Results: A synthetic result is filtered and opened with its score, evidence, rationale, inspection details, and audit trail still in view.
- Elephant: Sanitized example records are opened from a dataset down to individual encounters and files using keyboard-first navigation.